What's new in the 2nd Edition
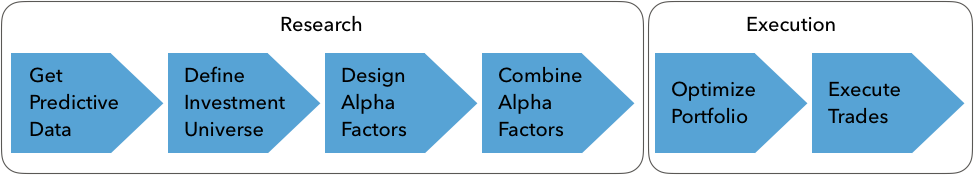
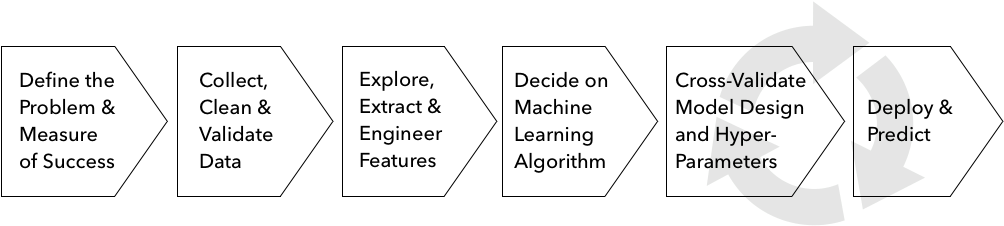
The 2nd edition adds numerous examples that illustrate the ML4T workflow from universe selection, feature engineering and ML model development to strategy design and evaluation. A new chapter on strategy backtesting shows how to work with backtrader and Zipline, and a new appendix describes and tests over 100 different alpha factors.
In addition, it replicates recently published research from top journals on topics such as extracting risk factors conditioned on stock characteristics with an autoencoder, how to create synthetic training data using GANs, or applying a CNN to time series converted to image format to predict returns.
The strategies now target asset classes and trading scenarios beyond US equities at daily frequency, like international stocks and ETFs or minute-frequency data for an intraday strategy. The 2nd edition also expands the coverage of alternative data to include SEC filings to predict earnings surprises, satellite images to classify land use, or financial news to extract topics.
Machine Learning for Trading: From Idea to Execution
This chapter explores industry trends that have led to the emergence of ML as a source of competitive advantage in the investment industry. We will also look at where ML fits into the investment process to enable algorithmic trading strategies.
More specifically, it covers the following topics:
- Key trends behind the rise of ML in the investment industry
- The design and execution of a trading strategy that leverages ML
- Popular use cases for ML in trading

Market and Fundamental Data: Sources and Techniques
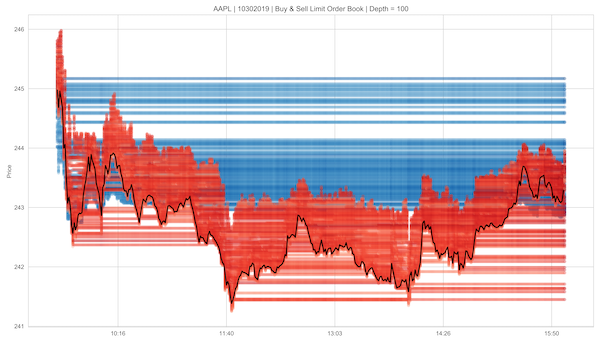
This chapter shows how to work with market and fundamental data and describes critical aspects of the environment that they reflect. For example, familiarity with various order types and the trading infrastructure matter not only for the interpretation of the data but also to correctly design backtest simulations. We also illustrate how to use Python to access and manipulate trading and financial statement data.
Practical examples demonstrate how to work with trading data from NASDAQ tick data and Algoseek minute bar data with a rich set of attributes capturing the demand-supply dynamic that we will later use for an ML-based intraday strategy. We also cover various data provider APIs and how to source financial statement information from the SEC.
- How market data reflects the structure of the trading environment
- Working with intraday trade and quotes data at minute frequency
- Reconstructing the limit order book from tick data using NASDAQ ITCH
- Summarizing tick data using various types of bars
- Working with XBRL-encoded electronic filings
- Parsing and combining price and fundamental data to create a P/E series
- How to access various market and fundamental data sources using Python
Alternative Data for Finance: Categories and Use Cases
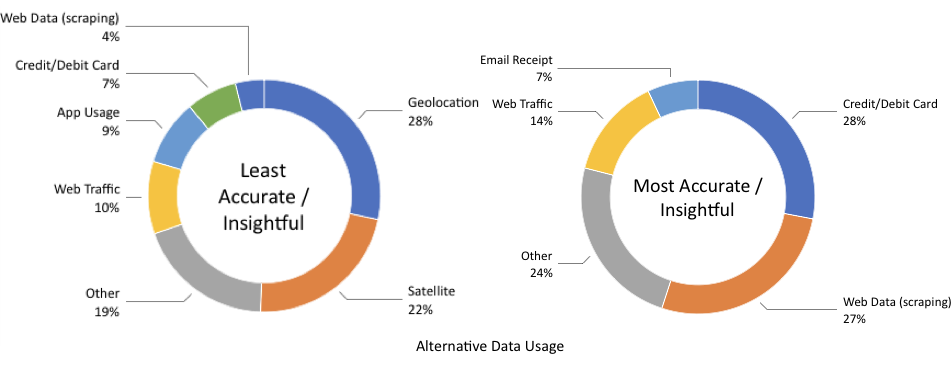
This chapter outlines categories and use cases of alternative data, describes criteria to assess the exploding number of sources and providers, and summarizes the current market landscape.
It also demonstrates how to create alternative data sets by scraping websites, such as collecting earnings call transcripts for use with natural language processing (NLP) and sentiment analysis algorithms in the third part of the book.
- Which new sources of signals have emerged during the alternative data revolution
- How individuals, business, and sensors generate a diverse set of alternative data
- Important categories and providers of alternative data
- Evaluating how the burgeoning supply of alternative data can be used for trading
- Working with alternative data in Python, such as by scraping the internet
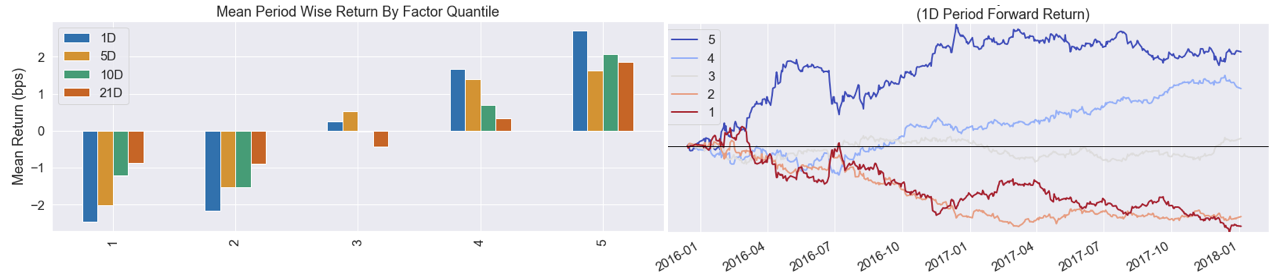
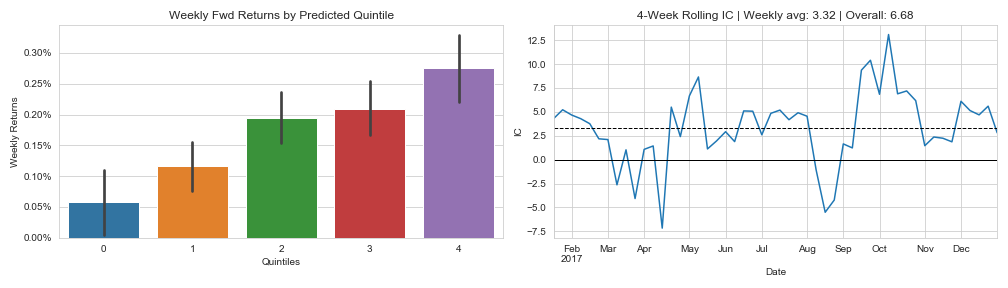
Financial Feature Engineering: How to research Alpha Factors
If you are already familiar with ML, you know that feature engineering is a crucial ingredient for successful predictions. It matters at least as much in the trading domain, where academic and industry researchers have investigated for decades what drives asset markets and prices, and which features help to explain or predict price movements.
This chapter outlines the key takeaways as a starting point for your own quest for alpha factors. It also presents essential tools to compute and test alpha factors, highlighting how the NumPy, pandas, and TA-Lib libraries facilitate the manipulation of data and present popular smoothing techniques like the wavelets and the Kalman filter that help reduce noise in data.
- Which categories of factors exist, why they work, and how to measure them,
- Creating e alpha factors using NumPy, pandas, and TA-Lib,
- How to denoise data using wavelets and the Kalman filter,
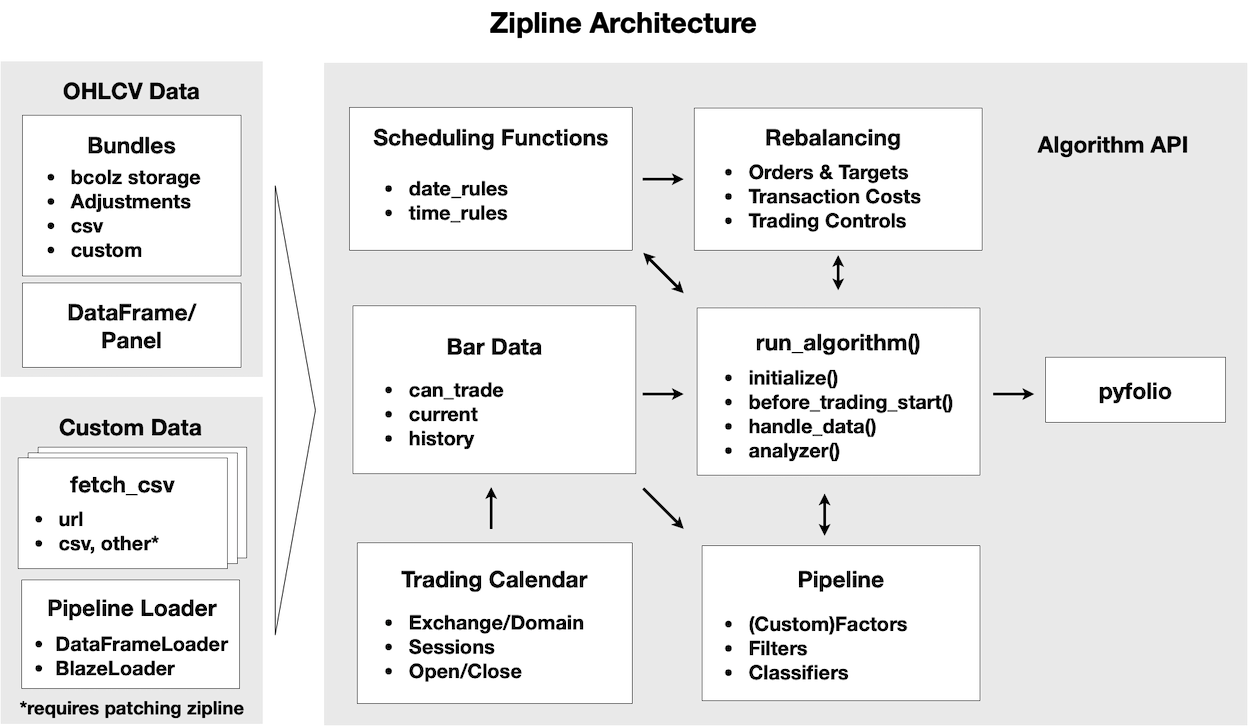
- Using e Zipline offline and on Quantopian to test individual and multiple alpha factors,
- How to use Alphalens to evaluate predictive performance using, among other metrics, the information coefficient.
Portfolio Optimization and Performance Evaluation
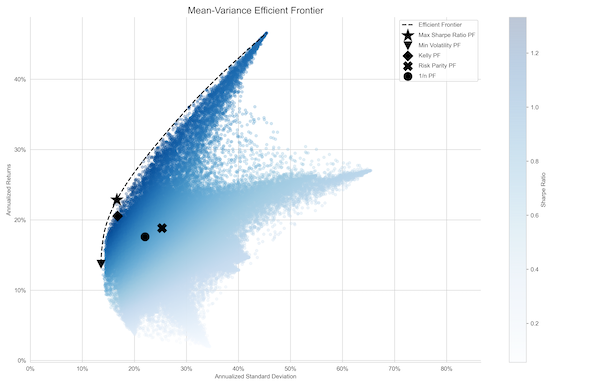
Alpha factors generate signals that an algorithmic strategy translates into trades, which, in turn, produce long and short positions. The returns and risk of the resulting portfolio determine whether the strategy meets the investment objectives.
There are several approaches to optimize portfolios. These include the application of machine learning (ML) to learn hierarchical relationships among assets and treat them as complements or substitutes when designing the portfolio's risk profile.
- How to measure portfolio risk and return
- Managing portfolio weights using mean-variance optimization and alternatives
- Using machine learning to optimize asset allocation in a portfolio context
- Simulating trades and create a portfolio based on alpha factors using Zipline
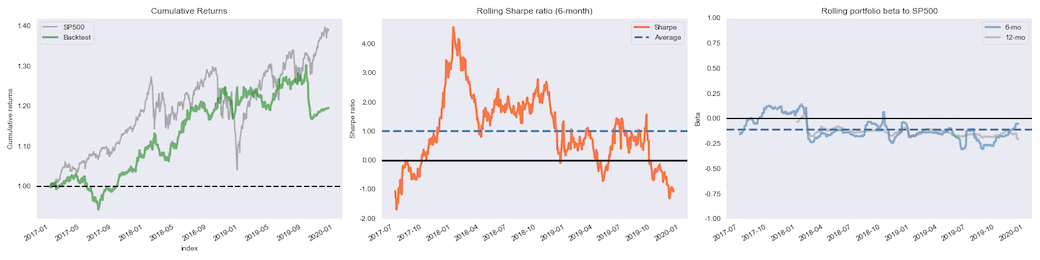
- How to evaluate portfolio performance using pyfolio
The Machine Learning Process
This chapter kicks off Part 2 that illustrates how you can use a range of supervised and unsupervised ML models for trading. We will explain each model's assumptions and use cases before we demonstrate relevant applications using various Python libraries.
There are several aspects that many of these models and their applications have in common. This chapter covers these common aspects so that we can focus on model-specific usage in the following chapters. It sets the stage by outlining how to formulate, train, tune, and evaluate the predictive performance of ML models as a systematic workflow.
- How supervised and unsupervised learning from data works
- Training and evaluating supervised learning models for regression and classification tasks
- How the bias-variance trade-off impacts predictive performance
- How to diagnose and address prediction errors due to overfitting
- Using cross-validation to optimize hyperparameters with time-series data
- Why financial data requires additional attention when testing out-of-sample
Linear Models: From Risk Factors to Return Forecasts
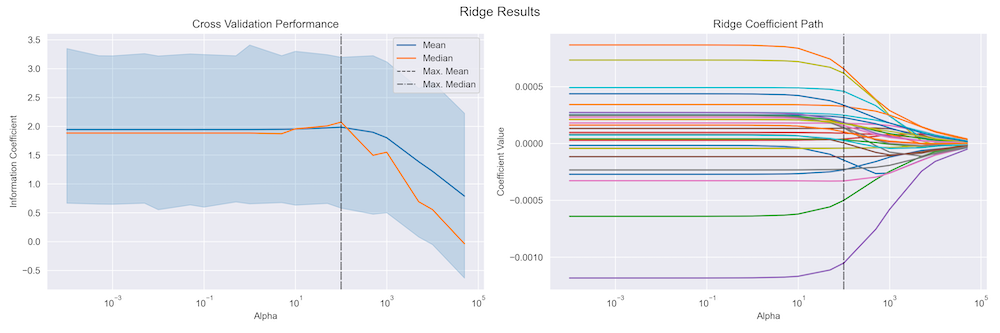
Linear models are standard tools for inference and prediction in regression and classification contexts. Numerous widely used asset pricing models rely on linear regression. Regularized models like Ridge and Lasso regression often yield better predictions by limiting the risk of overfitting.
Typical regression applications identify risk factors that drive asset returns to manage risks or predict returns. Classification problems, on the other hand, include directional price forecasts.
- How linear regression works and which assumptions it makes
- Designing, training and diagnosing linear regression models
- Using linear regression to predict stock returns a different horizons
- Applying Ridge and Lasso regularization for better predictive performance
- How logistic regression works in a trading context
- Converting a regression into a classification problem
The ML4T Workflow: From Model to Strategy Backtesting
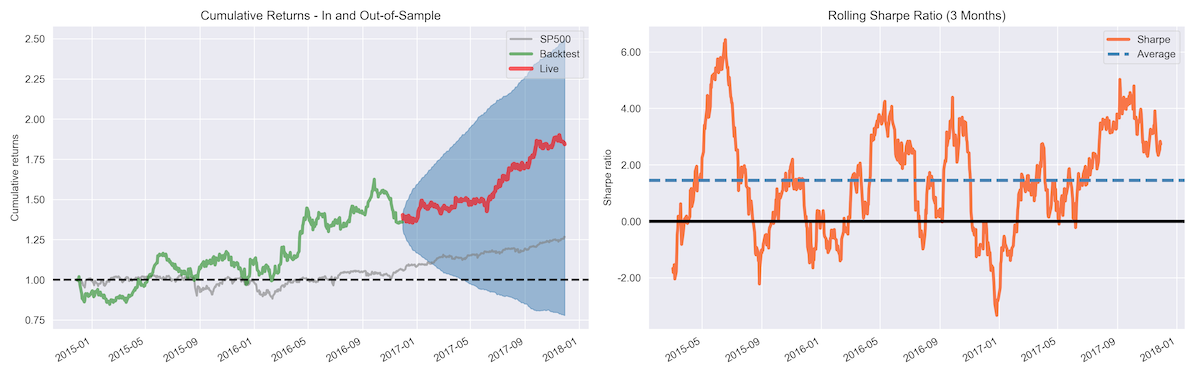
This chapter presents an end-to-end perspective on designing, simulating, and evaluating a trading strategy driven by an ML algorithm. We will demonstrate in detail how to backtest an ML-driven strategy in a historical market context using the Python libraries backtrader and Zipline.
The ML4T workflow ultimately aims to gather evidence from historical data that helps decide whether to deploy a candidate strategy in a live market and put financial resources at risk. A realistic simulation of your strategy needs to faithfully represent how security markets operate and how trades execute. Also, several methodological aspects require attention to avoid biased results and false discoveries that will lead to poor investment decisions.
- Plan and implement end-to-end strategy backtesting
- Understand and avoid critical pitfalls when implementing backtests
- Discuss the advantages and disadvantages of vectorized vs event-driven backtesting engines
- Identify and evaluate the key components of an event-driven backtester
- Design and execute the ML4T workflow at minute and daily frequencies
- Include ML models trained separately or as part of the backtest
- Use Zipline and backtrader to design and evaluate your own strategies
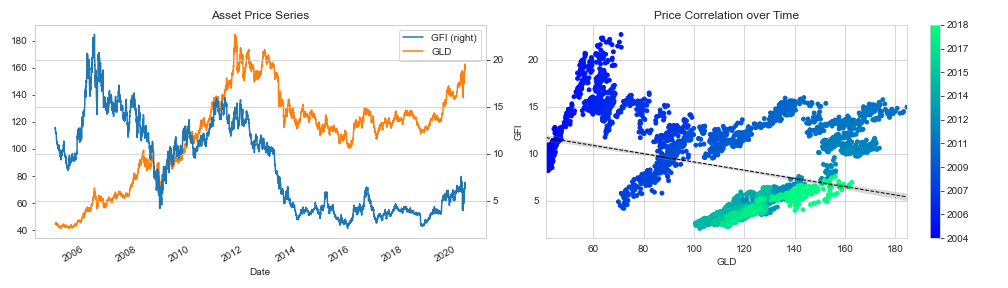
Time Series Models for Volatility Forecasts and Statistical Arbitrage
This chapter focuses on models that extract signals from a time series' history to predict future values for the same time series. Time series models are in widespread use due to the time dimension inherent to trading.
It presents tools to diagnose time series characteristics such as stationarity and extract features that capture potentially useful patterns. It also introduces univariate and multivariate time series models to forecast macro data and volatility patterns. Finally, it explains how cointegration identifies common trends across time series and shows how to develop a pairs trading strategy based on this crucial concept.
- How to use time-series analysis to prepare and inform the modeling process
- Estimating and diagnosing univariate autoregressive and moving-average models
- Building autoregressive conditional heteroskedasticity (ARCH) models to predict volatility
- How to build multivariate vector autoregressive models
- Using cointegration to develop a pairs trading strategy
Bayesian ML: Dynamic Sharpe Ratios and Pairs Trading
This chapter introduces how Bayesian approaches to ML and their different perspective on uncertainty add value when developing and evaluating trading strategies. Bayesian statistics allows us to quantify uncertainty about future events and refine estimates in a principled way as new information arrives. This dynamic approach adapts well to the evolving nature of financial markets.
Bayesian approaches to ML enable new insights into the uncertainty around statistical metrics, parameter estimates, and predictions. The applications range from more granular risk management to dynamic updates of predictive models that incorporate changes in the market environment.
- How Bayesian statistics applies to machine learning
- Probabilistic programming with PyMC3
- Defining and training machine learning models using PyMC3
- How to run state-of-the-art sampling methods to conduct approximate inference
- Bayesian ML applications to compute dynamic Sharpe ratios, dynamic pairs trading hedge ratios, and estimate stochastic volatility
Random Forests: A Long-Short Strategy for Japanese Stocks
This chapter applies decision trees and random forests to trading. Decision trees learn rules from data that encode nonlinear input-output relationships. We show how to train a decision tree to make predictions for regression and classification problems, visualize and interpret the rules learned by the model, and tune the model's hyperparameters to optimize the bias-variance tradeoff and prevent overfitting.
The second part of the chapter introduces ensemble models that combine multiple decision trees in a randomized fashion to produce a single prediction with a lower error. It concludes with a long-short strategy for Japanese equities based on trading signals generated by a random forest model.
- Use decision trees for regression and classification
- Gain insights from decision trees and visualize the rules learned from the data
- Understand why ensemble models tend to deliver superior results
- Use bootstrap aggregation to address the overfitting challenges of decision trees
- Train, tune, and interpret random forests
- Employ a random forest to design and evaluate a profitable trading strategy
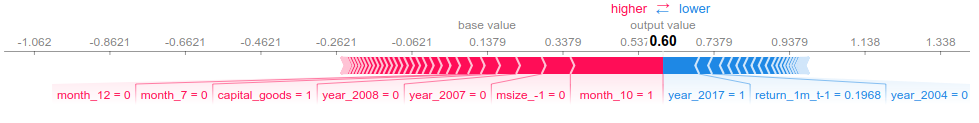
Boosting your Trading Strategy: From Daily to Intraday Data
Gradient boosting is an alternative tree-based ensemble algorithm that often produces better results than random forests. The critical difference is that boosting modifies the data used to train each tree based on the cumulative errors made by the model. While random forests train many trees independently using random subsets of the data, boosting proceeds sequentially and reweights the data.
This chapter shows how state-of-the-art libraries achieve impressive performance and apply boosting to both daily and high-frequency data to backtest an intraday trading strategy.
- Understand how boosting differs from bagging and how gradient boosting evolved from adaptive boosting,
- Design and tune adaptive boosting and gradient boosting models with scikit-learn,
- Build, optimize, and evaluate gradient boosting models on large datasets with the state-of-the-art implementations XGBoost, LightGBM, and CatBoost,
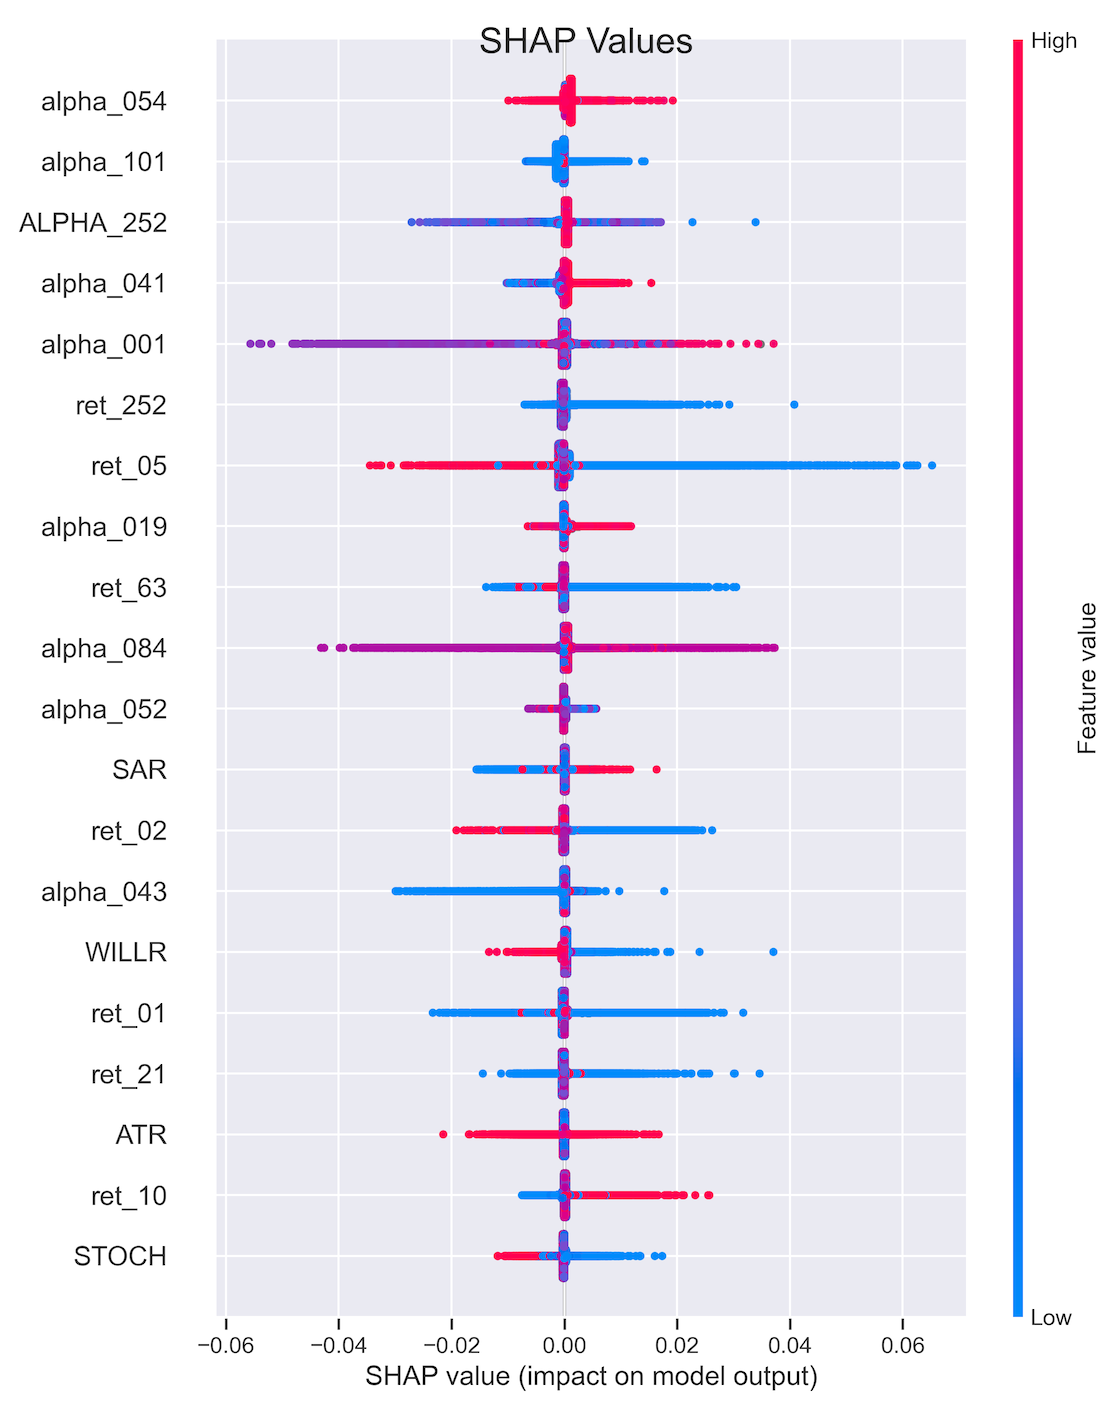
- Interpret and gain insights from gradient boosting models using SHAP values,
- Use boosting with high-frequency data to design an intraday strategy.
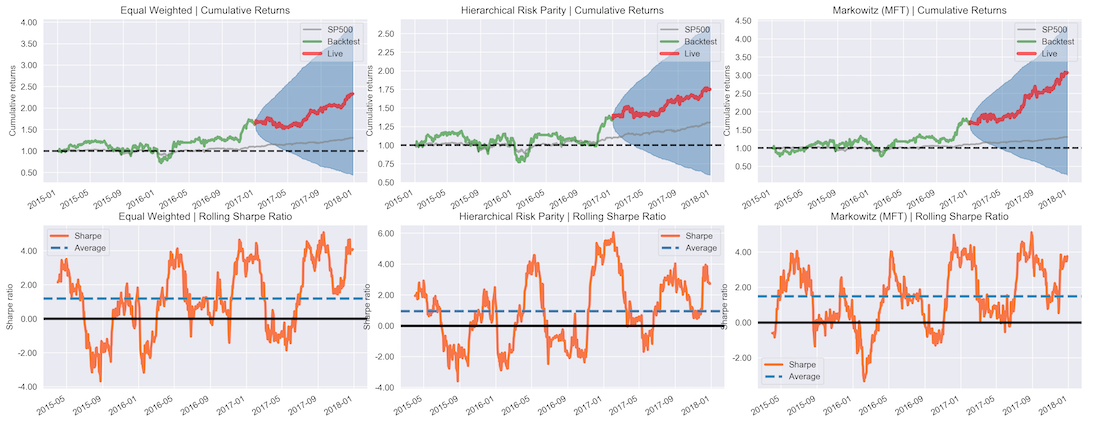
Data-Driven Risk Factors and Asset Allocation with Unsupervised Learning
Dimensionality reduction and clustering are the main tasks for unsupervised learning:
Dimensionality reduction transforms the existing features into a new, smaller set while minimizing the loss of information. A broad range of algorithms exists that differ by how they measure the loss of information, whether they apply linear or non-linear transformations or the constraints they impose on the new feature set.
Clustering algorithms identify and group similar observations or features instead of identifying new features. Algorithms differ in how they define the similarity of observations and their assumptions about the resulting groups.
- How principal and independent component analysis perform linear dimensionality reduction
- Identifying data-driven risk factors and eigenportfolios from asset returns
- Effectively visualizing nonlinear, high-dimensional data using manifold learning
- Using t-SNE and UMAP to explore high-dimensional image data
- How k-means, hierarchical, and density-based clustering algorithms work
- Using agglomerative clustering to build robust portfolios with hierarchical risk parity
Text Data for Trading: Sentiment Analysis
Text data is very rich in content but highly unstructured so that it requires more preprocessing to enable an ML algorithm to extract relevant information. A key challenge consists of converting text into a numerical format without losing its meaning.
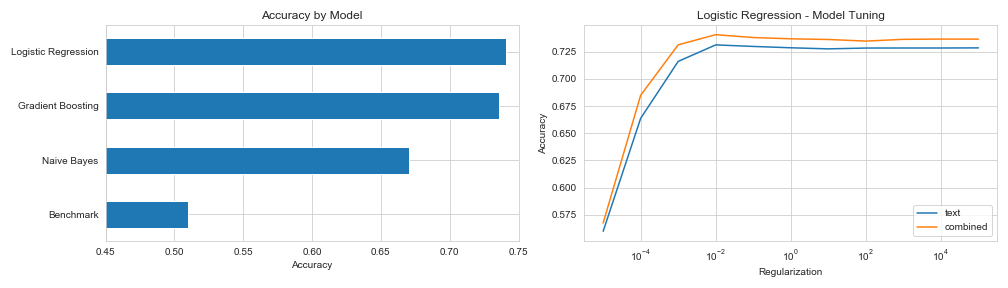
This chapter shows how to represent documents as vectors of token counts by creating a document-term matrix that, in turn, serves as input for text classification and sentiment analysis. It also introduces the Naive Bayes algorithm and compares its performance to linear and tree-based models.
- What the fundamental NLP workflow looks like
- How to build a multilingual feature extraction pipeline using spaCy and TextBlob
- Performing NLP tasks like part-of-speech tagging or named entity recognition
- Converting tokens to numbers using the document-term matrix
- Classifying news using the naive Bayes model
- How to perform sentiment analysis using different ML algorithms
Topic Modeling: Summarizing Financial News
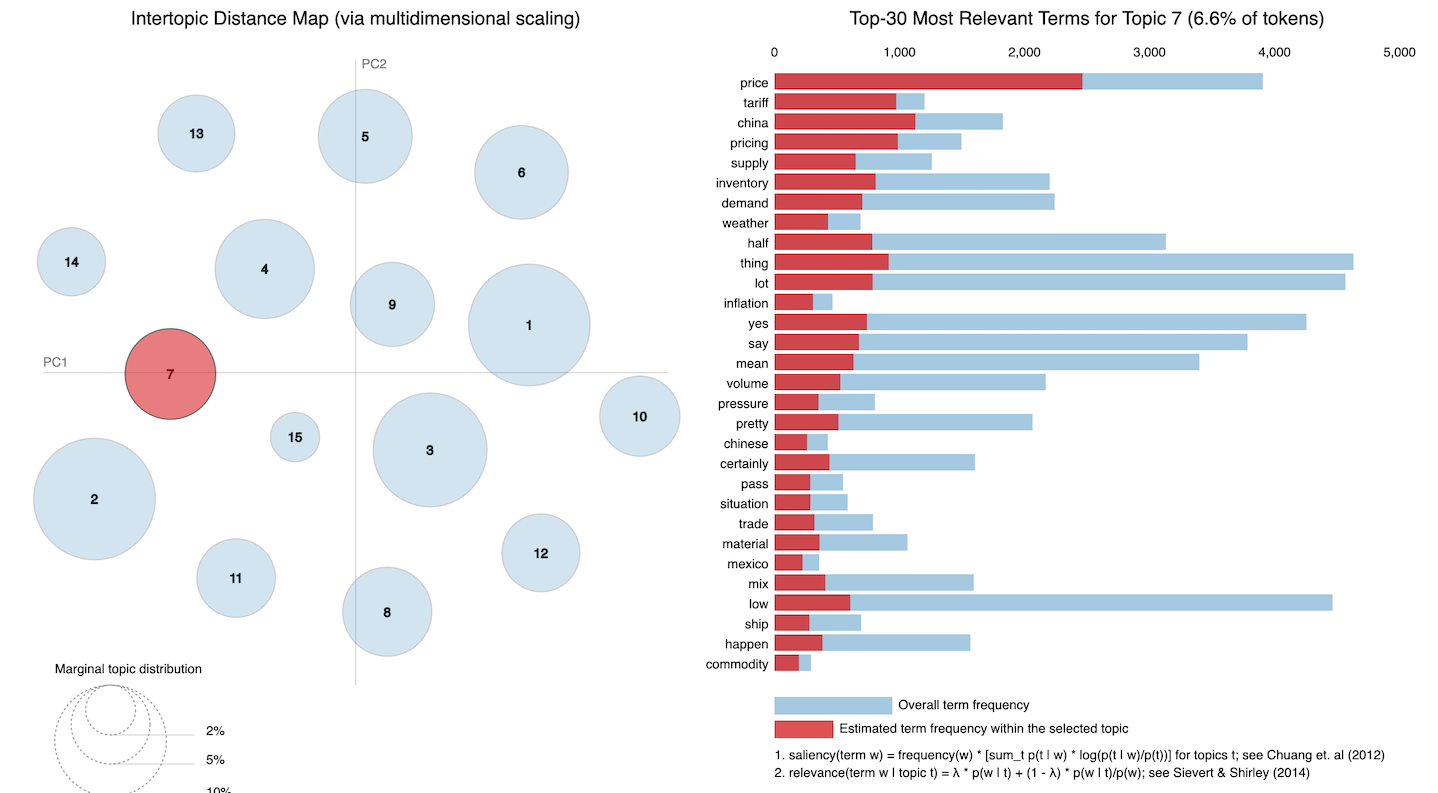
This chapter uses unsupervised learning to model latent topics and extract hidden themes from documents. These themes can generate detailed insights into a large corpus of financial reports.
Topic models automate the creation of sophisticated, interpretable text features that, in turn, can help extract trading signals from extensive collections of texts. They speed up document review, enable the clustering of similar documents, and produce annotations useful for predictive modeling.
Applications include identifying critical themes in company disclosures, earnings call transcripts or contracts, and annotation based on sentiment analysis or using returns of related assets.
- How topic modeling has evolved, what it achieves, and why it matters
- Reducing the dimensionality of the DTM using latent semantic indexing
- Extracting topics with probabilistic latent semantic analysis (pLSA)
- How latent Dirichlet allocation (LDA) improves pLSA to become the most popular topic model
- Visualizing and evaluating topic modeling results -
- Running LDA using scikit-learn and gensim
- How to apply topic modeling to collections of earnings calls and financial news articles
Word embeddings for Earnings Calls and SEC Filings
This chapter uses neural networks to learn a vector representation of individual semantic units like a word or a paragraph. These vectors are dense with a few hundred real-valued entries, compared to the higher-dimensional sparse vectors of the bag-of-words model. As a result, these vectors embed or locate each semantic unit in a continuous vector space.
Embeddings result from training a model to relate tokens to their context with the benefit that similar usage implies a similar vector. As a result, they encode semantic aspects like relationships among words through their relative location. They are powerful features that we will use with deep learning models in the following chapters.
- What word embeddings are and how they capture semantic information
- How to obtain and use pre-trained word vectors
- Which network architectures are most effective at training word2vec models
- How to train a word2vec model using TensorFlow and gensim
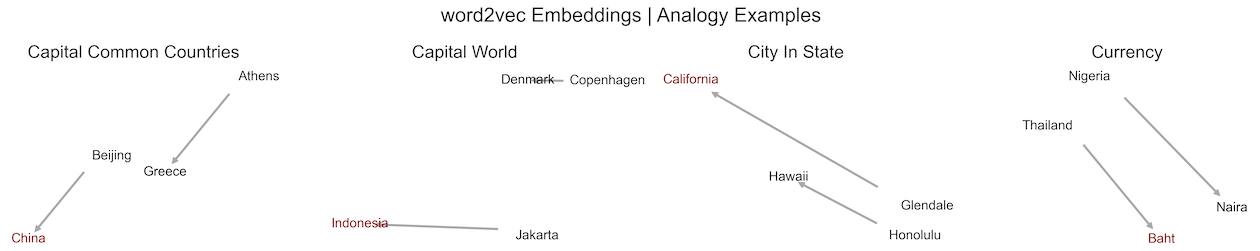
- Visualizing and evaluating the quality of word vectors
- How to train a word2vec model on SEC filings to predict stock price moves
- How doc2vec extends word2vec and can be used for sentiment analysis
- Why the transformer’s attention mechanism had such an impact on NLP
- How to fine-tune pre-trained BERT models on financial data
Deep Learning for Trading
This chapter presents feedforward neural networks (NN) and demonstrates how to efficiently train large models using backpropagation while managing the risks of overfitting. It also shows how to use TensorFlow 2.0 and PyTorch and how to optimize a NN architecture to generate trading signals.
n the following chapters, we will build on this foundation to apply various architectures to different investment applications with a focus on alternative data. These include recurrent NN tailored to sequential data like time series or natural language and convolutional NN, particularly well suited to image data. We will also cover deep unsupervised learning, such as how to create synthetic data using Generative Adversarial Networks (GAN). Moreover, we will discuss reinforcement learning to train agents that interactively learn from their environment.
- How DL solves AI challenges in complex domains
- Key innovations that have propelled DL to its current popularity
- How feedforward networks learn representations from data
- Designing and training deep neural networks (NNs) in Python
- Implementing deep NNs using Keras, TensorFlow, and PyTorch
- Building and tuning a deep NN to predict asset returns
- Designing and backtesting a trading strategy based on deep NN signals
CNN for Financial Time Series and Satellite Images
CNN architectures continue to evolve. This chapter describes building blocks common to successful applications, demonstrates how transfer learning can speed up learning, and how to use CNNs for object detection.
CNNs can generate trading signals from images or time-series data. Satellite data can anticipate commodity trends via aerial images of agricultural areas, mines, or transport networks. Camera footage can help predict consumer activity; we show how to build a CNN that classifies economic activity in satellite images.
CNNs can also deliver high-quality time-series classification results by exploiting their structural similarity with images, and we design a strategy based on time-series data formatted like images.
- How CNNs employ several building blocks to efficiently model grid-like data
- Training, tuning and regularizing CNNs for images and time series data using TensorFlow
- Using transfer learning to streamline CNNs, even with fewer data
- Designing a trading strategy using return predictions by a CNN trained on time-series data formatted like images
- How to classify economic activity based on satellite images

RNN for Multivariate Time Series and Sentiment Analysis
Recurrent neural networks (RNNs) compute each output as a function of the previous output and new data, effectively creating a model with memory that shares parameters across a deeper computational graph. Prominent architectures include Long Short-Term Memory (LSTM) and Gated Recurrent Units (GRU) that address the challenges of learning long-range dependencies.
RNNs are designed to map one or more input sequences to one or more output sequences and are particularly well suited to natural language. They can also be applied to univariate and multivariate time series to predict market or fundamental data. This chapter covers how RNN can model alternative text data using the word embeddings that we covered in Chapter 16 to classify the sentiment expressed in documents.
- How recurrent connections allow RNNs to memorize patterns and model a hidden state
- Unrolling and analyzing the computational graph of RNNs
- How gated units learn to regulate RNN memory from data to enable long-range dependencies
- Designing and training RNNs for univariate and multivariate time series in Python
- How to learn word embeddings or use pretrained word vectors for sentiment analysis with RNNs
- Building a bidirectional RNN to predict stock returns using custom word embeddings
Autoencoders for Conditional Risk Factors and Asset Pricing
This chapter shows how to leverage unsupervised deep learning for trading. More specifically, we discuss autoencoders, namely a neural network trained to reproduce the input while learning a new representation encoded by the parameters of a hidden layer. Autoencoders have long been used for nonlinear dimensionality reduction, leveraging the NN architectures we covered in the last three chapters.
We replicate a recent AQR paper that shows how autoencoders can underpin a trading strategy. We will use a deep neural network that relies on an autoencoder to extract risk factors and predict equity returns, conditioned on a range of equity attributes.
- Which types of autoencoders are of practical use and how they work
- Building and training autoencoders using Python
- Using autoencoders to extract data-driven risk factors that take into account asset characteristics to predict returns
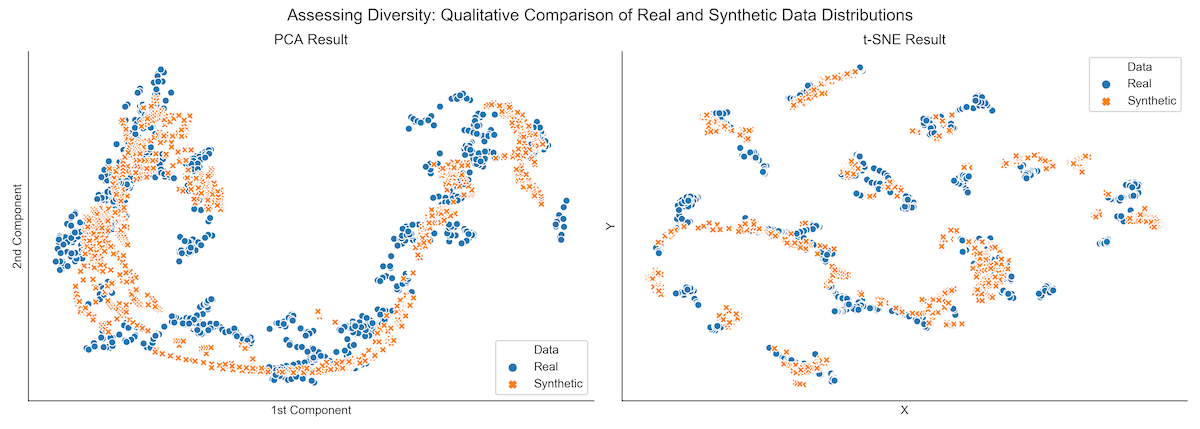
Generative Adversarial Nets for Synthetic Time Series Data
This chapter introduces generative adversarial networks (GAN). GANs train a generator and a discriminator network in a competitive setting so that the generator learns to produce samples that the discriminator cannot distinguish from a given class of training data. The goal is to yield a generative model capable of producing synthetic samples representative of this class.
While most popular with image data, GANs have also been used to generate synthetic time-series data in the medical domain. Subsequent experiments with financial data explored whether GANs can produce alternative price trajectories useful for ML training or strategy backtests. We replicate the 2019 NeurIPS Time-Series GAN paper to illustrate the approach and demonstrate the results.
- How GANs work, why they are useful, and how they could be applied to trading
- Designing and training GANs using TensorFlow 2
- Generating synthetic financial data to expand the inputs available for training ML models and backtesting
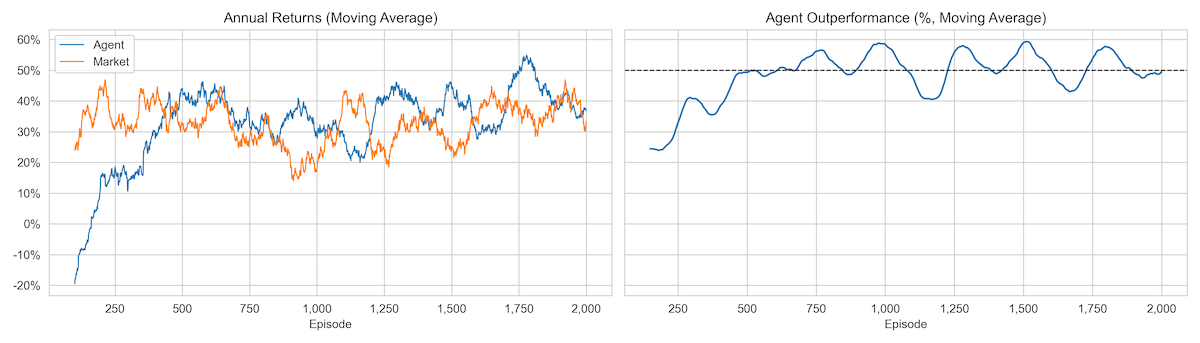
Deep Reinforcement Learning: Building a Trading Agent
Reinforcement Learning (RL) models goal-directed learning by an agent that interacts with a stochastic environment. RL optimizes the agent's decisions concerning a long-term objective by learning the value of states and actions from a reward signal. The ultimate goal is to derive a policy that encodes behavioral rules and maps states to actions.
This chapter shows how to formulate and solve an RL problem. It covers model-based and model-free methods, introduces the OpenAI Gym environment, and combines deep learning with RL to train an agent that navigates a complex environment. Finally, we'll show you how to adapt RL to algorithmic trading by modeling an agent that interacts with the financial market while trying to optimize an objective function.
- Define a Markov decision problem (MDP)
- Use value and policy iteration to solve an MDP
- Apply Q-learning in an environment with discrete states and actions
- Build and train a deep Q-learning agent in a continuous environment
- Use the OpenAI Gym to design a custom market environment and train an RL agent to trade stocks
Conclusions and Next Steps
In this concluding chapter, we will briefly summarize the essential tools, applications, and lessons learned throughout the book to avoid losing sight of the big picture after so much detail.
We will then identify areas that we did not cover but would be worth focusing on as you expand on the many machine learning techniques we introduced and become productive in their daily use.
- Review key takeaways and lessons learned
- Point out the next steps to build on the techniques in this book
- Suggest ways to incorporate ML into your investment process
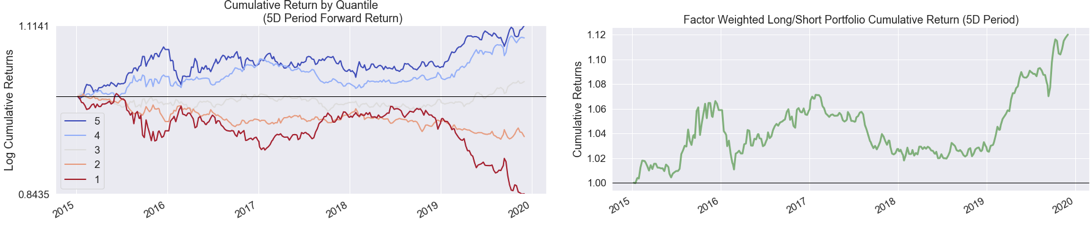
Appendix - Alpha Factor Library
Throughout this book, we emphasized how the smart design of features, including appropriate preprocessing and denoising, typically leads to an effective strategy. This appendix synthesizes some of the lessons learned on feature engineering and provides additional information on this vital topic.
To this end, we focus on the broad range of indicators implemented by TA-Lib and WorldQuant's 101 Formulaic Alphas paper, which presents real-life quantitative trading factors used in production with an average holding period of 0.6-6.4 days.
- How to compute several dozen technical indicators using TA-Lib and NumPy/pandas,
- Creating the formulaic alphas describe in the above paper, and
- Evaluating the predictive quality of the results using various metrics from rank correlation and mutual information to feature importance, SHAP values, and Alphalens..